
Fixed income
Stock returns’ sensitivity to interest rates and inflation expectations
Back to all
Global investors have focused intently on inflation and interest rate expectations over the last few years. In this article, we take stock of equities’ sensitivity to changes in interest rates and inflation expectations. We note a couple of exceptional findings regarding today's sensitivity compared to the last few decades.
Interest rates significantly influence stocks for different reasons. The most direct impact on companies comes from (re)financing costs. In this respect, higher rates negatively affect companies, leading to lower profits and a higher hurdle for corporate investments (less growth). A less direct and additionally negative impact from higher rates, comes from higher discount rates, which reduce the companies’ fair values as calculated by analysts. Based on these arguments alone, we might expect a negative correlation between stock returns and interest rate changes.
But when we consider what causes interest rates to change, the expected relationship between rates and stock prices becomes more complex. Lower rates may signal lower growth expectations and/or heightened risk perception, both negatively impacting stock prices. Based on these arguments, one might expect a positive correlation between rates and stock prices—But when lower yields are triggered by expected monetary easing, they could again be viewed as positive for stocks. It is clear, then, that the correlation between stocks and interest rates is influenced by opposing forces, whose significance varies over time.
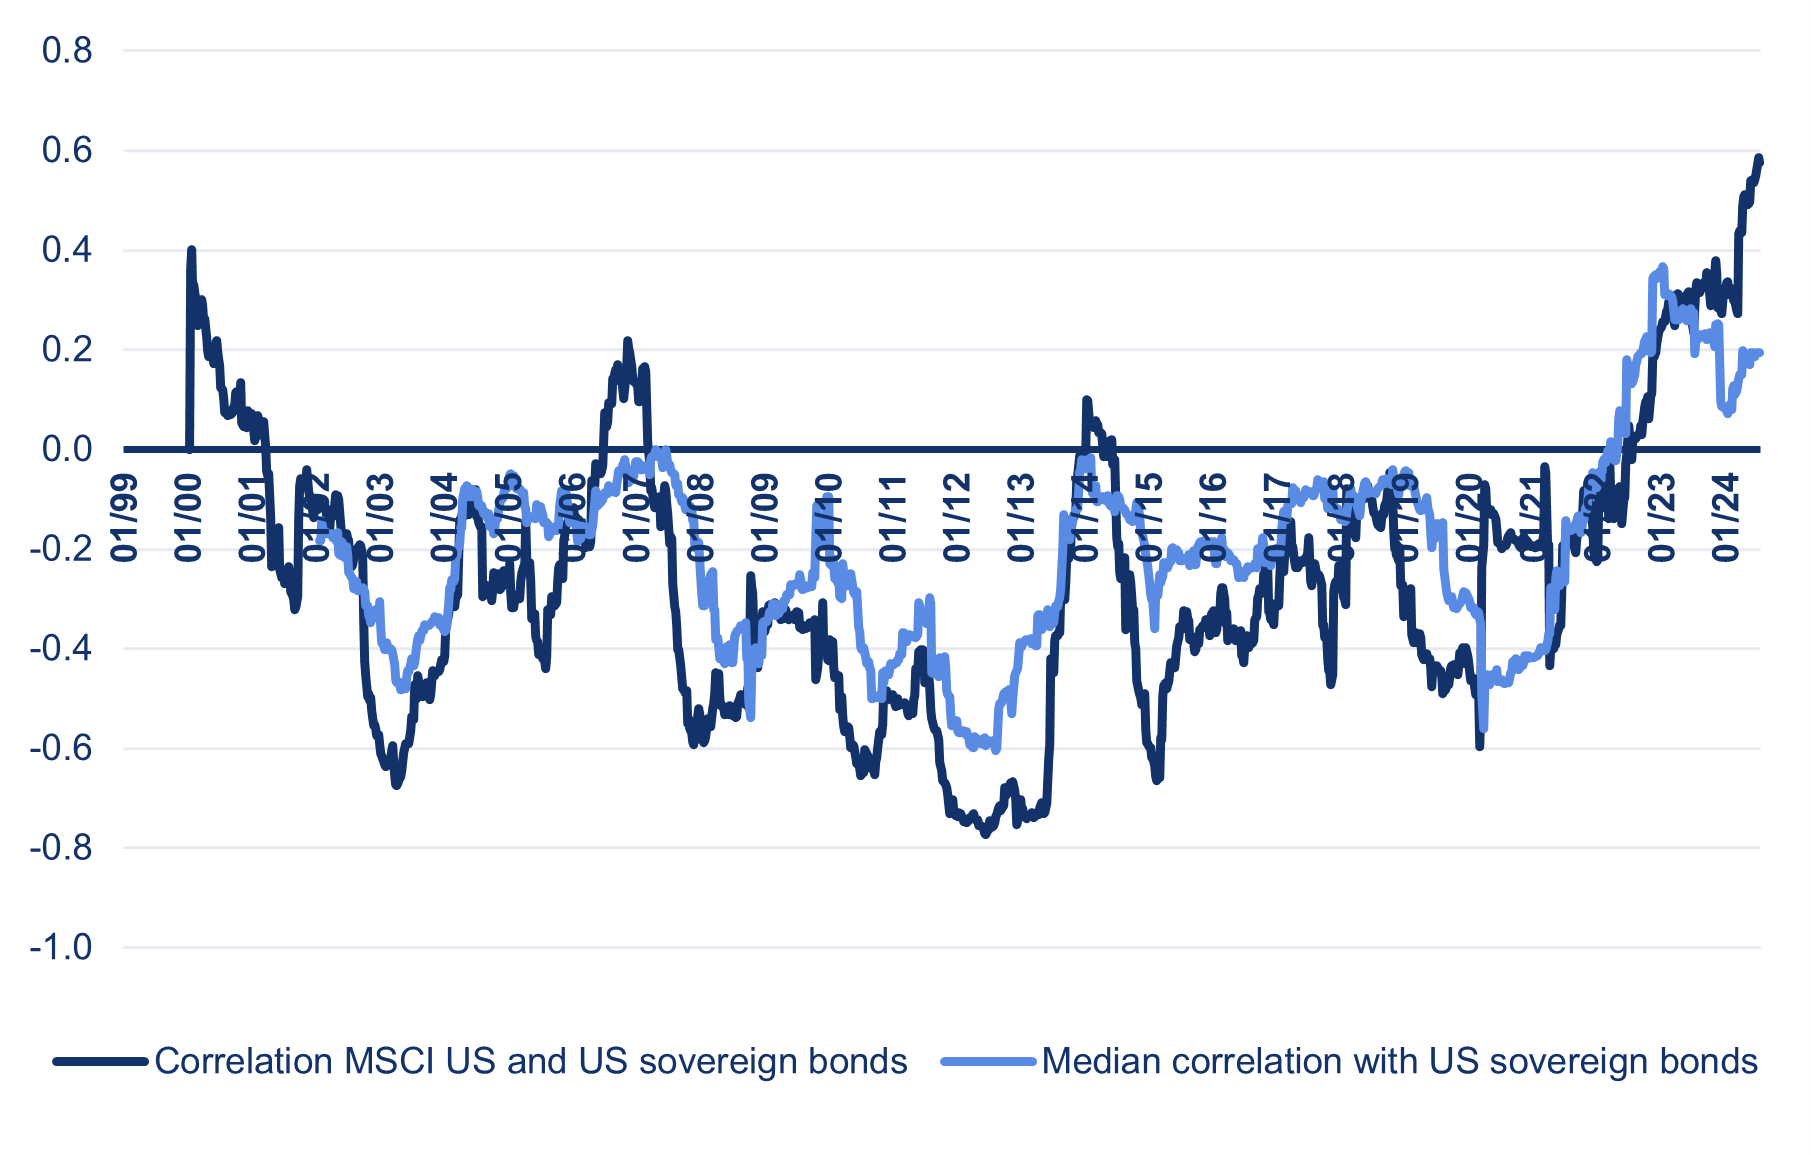
The chart below shows the correlation between US equities and US Treasury returns, essentially representing the inverse of interest rate movements. We can indeed see significant fluctuations over time, with the correlation typically negative during the first two decades of this millennium. Over the last few years, the correlation has increased to a level currently surpassing that at the end of the nineties. Today’s positive correlation between stocks and bonds is a testament to how inflation and interest rate levels have increasingly been considered worrisome in recent years.
The same chart also shows the median correlation with US Treasuries for MSCI US constituents. Due to stock-specific risks, it turns out that the average stock return is driven less by interest rate changes than the overall equity market return: Today, returns for the whole stock market are more positively correlated with US Treasuries than the average stock is. In the first two decades of the millennium, equity market returns were generally more negatively correlated with the bond market than the average stock was.
Discussing the correlation between individual stocks and bond market returns, we find that the returns of the ‘Magnificent 7’ are currently no more positively correlated with the bond market than the overall equity market. In fact, the median correlation between a Magnificent 7 stock and the bond market stands at 0.12, slightly lower than the median for MSCI US constituents. We also find that the Magnificent 7 equity index is currently less correlated with US sovereign bonds than the broader market. This is a shift from 2020 when the Magnificent 7 was clearly positively correlated with US Treasuries, while the broader market was still negatively correlated.
Correlation MSCI US & US Government bonds
Source: DPAM, 2024
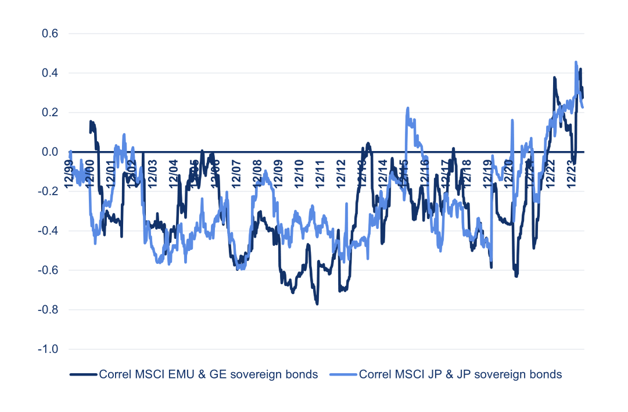
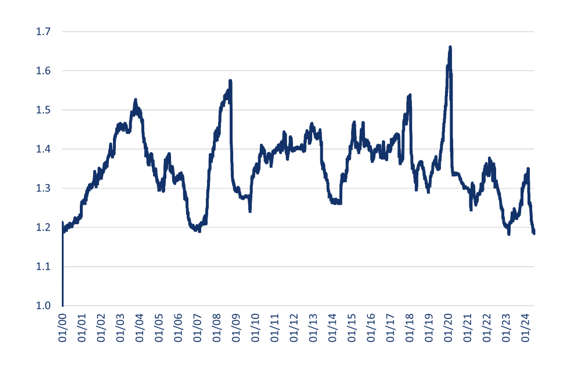
The rising correlation between equities and bonds is a global phenomenon, even though central banks' monetary policies are not all aligned. The historical correlation between equities and government bonds in Europe and Japan—illustrated in the chart below—clearly resembles the pattern observed in the US. An unfortunate consequence of this increased correlation is that diversification benefits have diminished for balanced portfolios. The diversification ratio for a portfolio investing 50% in the MSCI World and 50% in US Treasuries is currently near its lowest point in the last 25 years—about two standard deviations below its mean. It is now at levels similar to those seen in 2000 and 2007.
Correlation between equities and sovereign bonds
Source: DPAM, 2024
Diversification ratio 50-50 MSCI World and UST portfolio
Source: DPAM, 2024
Until now, we have investigated the correlation between stock and bond returns. Now, we turn our attention to stocks’ correlation with changes in inflation expectations and interest rates over different horizons. Several conclusions can be drawn from the table below.

Source: DPAM, 2024
Firstly, it appears equity investors are currently more concerned about changes in interest rates than inflation expectations in the medium and long term, assuming that the BE inflation is an effective measure of investors’ inflation expectations. The correlation with the 5-year and 10-year rates is clearly more negative than with the 5-year and 10-year break-even inflation.
Secondly, we find that changes in longer-term rates matter more for stock returns today than changes in short-term rates. This holds true for both US and EU equity returns. Changes in short-term interest rates, indicative of monetary policy expectations, are less important than the height of long-term financing costs and the trade-off between the relative attractiveness of equities and long-term bonds.
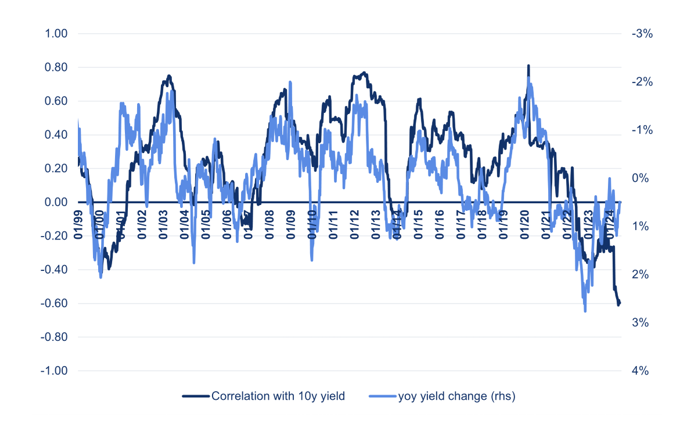
The most impressive figure in the table is today’s correlation between US equity market returns and changes in the US 10-year yield. At a level of -0.6, it implies a staggering 36% (r2) of the variability in US stock market returns can be associated to changes in the 10-year yield, a record for this millennium.
Investigating the historical evolution of the US equity market’s correlation with changes in the US 10-year yield, we make a remarkable observation: The correlation roughly follows the inverse of the year-over-year changes in the 10-year rate, as shown in the graph below. This suggests the correlation between stocks and interest rates decreases when interest rates increase and vice versa. Today, there is a rare divergence: based on its past relationship with interest rate movements, we could expect a reversion of the correlation in the US towards more uncorrelated territory. It makes sense, that more stable year-over-year inflation expectations and rates would eventually lead to equity investors being less unnerved by rate changes. Today, however, they are still very sensitive to them.
Correlation between US equity and UST 10y yield versus YoY yield change
Source: DPAM, 2024
Equity market segments’ sensitivity to interest rates and inflation expectations
With lower diversification benefits coming from combining equities and bonds, we now investigate the extent to which different equity market segments are sensitive to changes in interest rates and inflation expectations. This is relevant to position for a particular economic scenario, or to control a balanced/equity portfolio’s absolute or relative volatility.
A couple of equity market segments are believed to have significant correlations—either positive or negative—with changes in interest rates and/or inflation expectations. Real estate stocks and small caps are two examples of equity market segments that are generally believed to be more dependent on debt financing, and thus more sensitive to interest rate levels. Conversely, financials, are believed to be on the other side of the spectrum, especially when higher yields imply a steeper yield curve—increasing the profitability of maturity transformation businesses. Below, we investigate the correlation between a few equity market segments and the 10-year yield, which—as we have seen—is an important factor for today’s equity markets. For this analysis, we use the relative returns of the respective MSCI indices compared to the broad equity market.
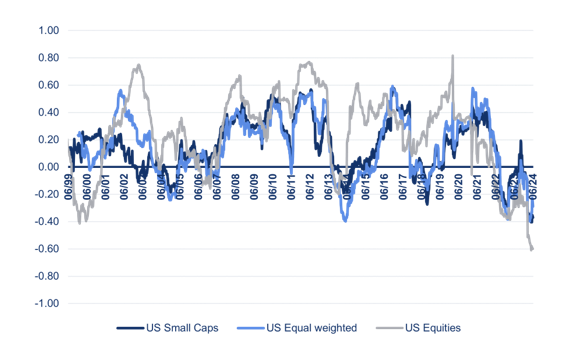
First, we investigate this correlation for US small caps. As shown in the chart below, for the majority of the past 25 years, higher US 10-year yields were actually associated with a stronger performance of US small caps. In fact, the correlation of US small caps’ relative returns with rates follows a path similar to the correlation between US equities’ absolute returns and the 10-year yield. Over the last few decades, higher rates generally have often indicated a stronger economy and/or less uncertainty—boosting both US equity absolute returns, as well as US small caps’ relative returns. It is only over the last few years that higher rates have been associated with more expected headwinds, both for the broader market as well as for US small caps’ relative returns. Finally, it is striking to see that the relative returns for the US equally weighted index show a correlation with 10-year rates that is very similar to the correlation of US small caps’ relative returns and rates.
Correlation US Small caps and MSCI US Equal weighted with 10y yield
Source: DPAM, 2024
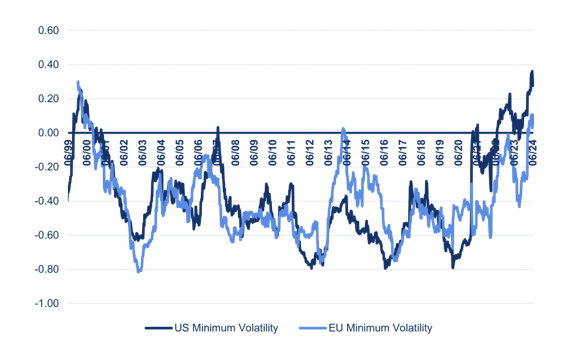
Correlation MSCI Minimum volatility indices with 10y yield
Source: DPAM, 2024
Next, we investigate the correlation for low volatility equities. From the analysis above, we already know that—except for the last few years—lower rates have typically indicated more economic challenges and increased risk. These findings align with the performance of the US and European Minimum Volatility indices, whose relative returns have been negatively correlated with rates over the first two decades of this millennium., higher rates are associated with higher relative returns for low volatility stocks, in contrast to the previous two decades.
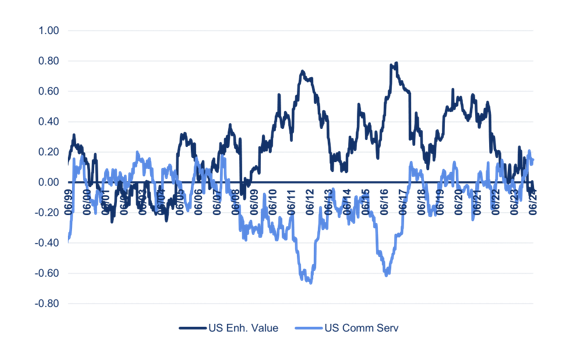
Also, for US value stocks—measured using the MSCI US Enhanced Value index—the correlation with rates has clearly shifted, although it has not reversed. At the moment, US value stocks’ relative returns are uncorrelated to interest rate changes. US Communication Services—often put in the Growth camp—show a historical correlation with rates that resembles the inverse of the correlation with US Value stocks. Still, over the last seven years, the US Communication Services sector no longer shows a negative correlation with rates, contrary to common belief.
Correlation MSCI US Enhanced Value and Communication Services with 10y yield
Source: DPAM, 2024
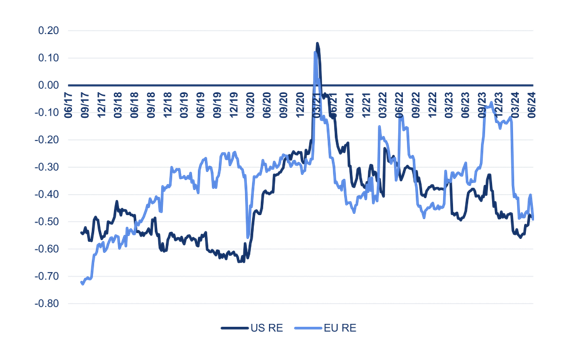
Correlation R.E. stocks with 10y yield
Source: DPAM, 2024
Despite all the examples of shifting correlations mentioned above, a few certainties remain regarding equity market segments’ correlation with rates and inflation expectations. For instance, US and European real estate stocks continue to be reliably negatively correlated with rates. Conversely, energy stocks remain positively correlated with both rates and inflation expectations on both sides of the Atlantic.
Conclusion
Today, stock returns are negatively correlated with changes in long-term interest rates and inflation expectations. This nervosity over higher rates and inflation clearly contrasts with the previous era when stocks generally thrived under higher rates and inflation expectations. The negative correlation has become a global phenomenon over the past few years, lowering the diversification benefits within balanced portfolios. Investors wanting to position their portfolios for specific interest rate scenarios through active weights in certain equity market segments need to be aware that several of these segments have recently seen their correlations with rates reverse. This reversal closely mirrors that observed in the aggregate equity market’s sensitivity to rates. Assuming that the relationship between equity market segments and rates/inflation expectations is stable could have been a costly mistake for investors over the past few years. Therefore, it is wise to formally verify these correlations rather than rely on past experiences. The good news for diversification within balanced portfolios is that the correlation between stocks and bonds seems to follow the inverse of the year-over-year changes in rates, suggesting that correlations are likely to shift towards more neutral levels.
Disclaimer
Degroof Petercam Asset Management SA/NV (DPAM) l rue Guimard 18, 1040 Brussels, Belgium l RPM/RPR Brussels l TVA BE 0886 223 276 l
Marketing Communication. Investing incurs risks.
The views and opinions contained herein are those of the individuals to whom they are attributed and may not necessarily represent views expressed or reflected in other DPAM communications, strategies or funds.
The provided information herein must be considered as having a general nature and does not, under any circumstances, intend to be tailored to your personal situation. Its content does not represent investment advice, nor does it constitute an offer, solicitation, recommendation or invitation to buy, sell, subscribe to or execute any other transaction with financial instruments. Neither does this document constitute independent or objective investment research or financial analysis or other form of general recommendation on transaction in financial instruments as referred to under Article 2, 2°, 5 of the law of 25 October 2016 relating to the access to the provision of investment services and the status and supervision of portfolio management companies and investment advisors. The information herein should thus not be considered as independent or objective investment research.
Past performances do not guarantee future results. All opinions and financial estimates are a reflection of the situation at issuance and are subject to amendments without notice. Changed market circumstance may render the opinions and statements incorrect.